A regular bathroom scale tells you one number: total weight. For seniors, that number is nearly useless on its own. Losing 5 pounds of muscle while gaining 5 pounds of fat shows the same weight but represents a significant health decline.
A smart scale that measures body composition (body fat percentage, muscle mass, water percentage, bone mass) provides the complete picture you need to know whether your exercise program is actually working the way you want it to.
What Smart Scales Measure
Bioelectrical Impedance Analysis (BIA)
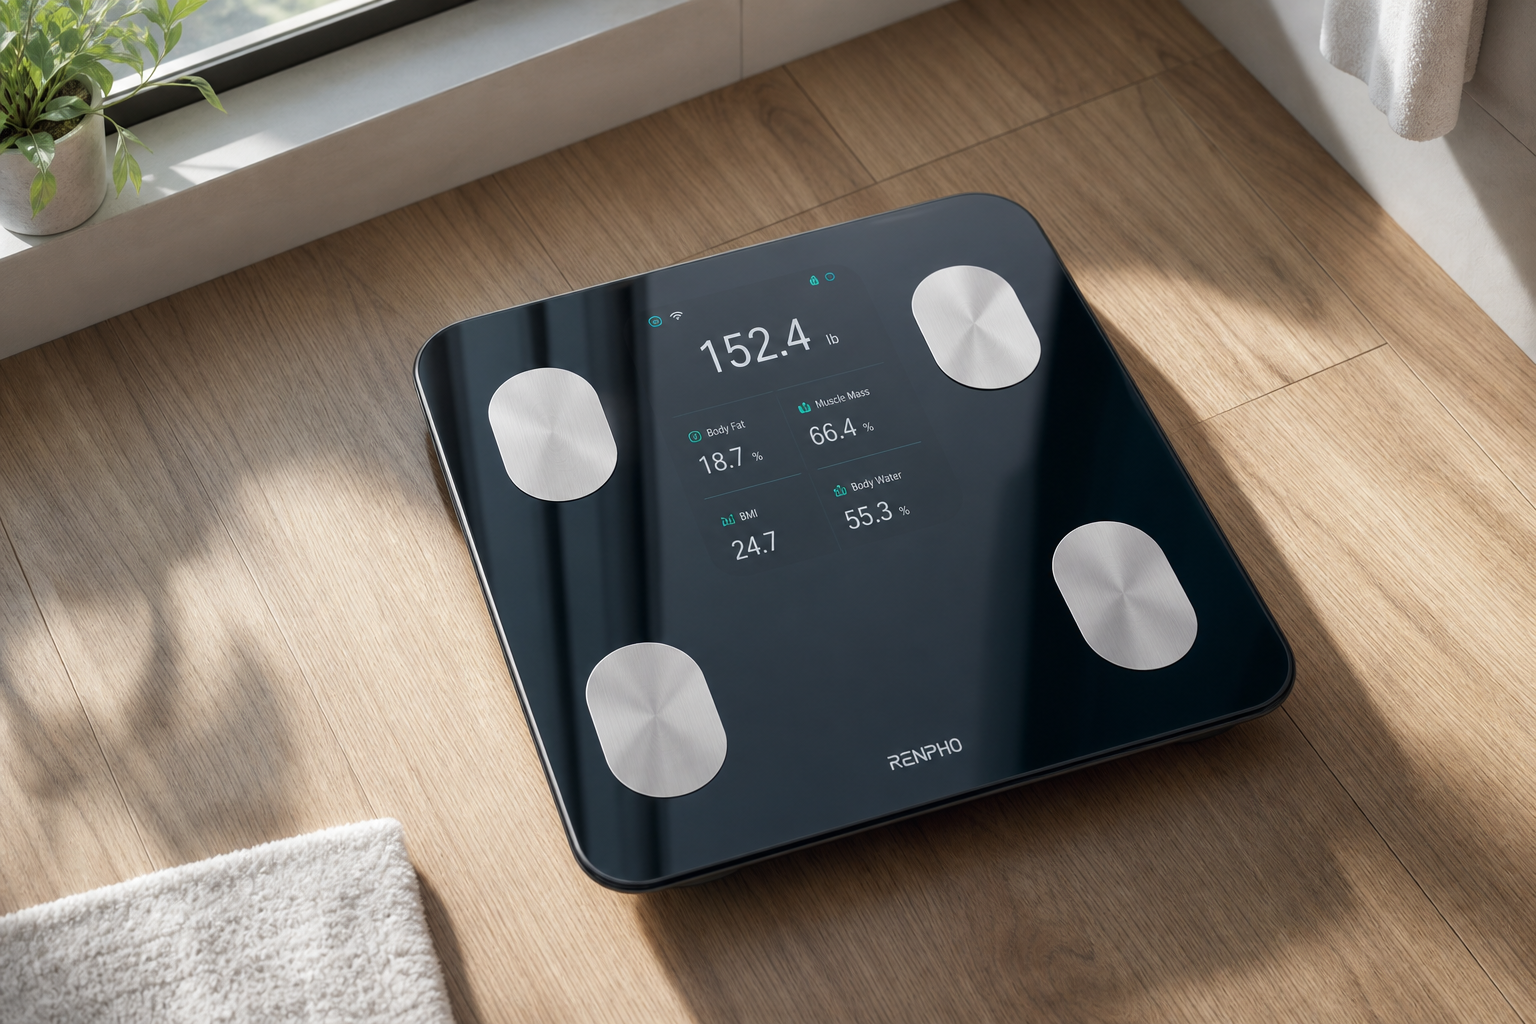
Smart scales send a tiny, painless electrical current through your body via the metal plates you stand on. The current passes through different tissues at different speeds: muscle (which contains water) conducts well, fat (which resists current) conducts poorly, and bone falls somewhere between.
By measuring the resistance (impedance), the scale estimates your body composition percentages.
The accuracy isn’t perfect. Compared to DEXA scans (the clinical gold standard), smart scales typically show a 5-8% margin of error on body fat percentage. That sounds worse than it is. The absolute number matters less than the trend data.
Changes over weeks and months are reliable and actionable. If your body fat percentage drops from 32% to 28% over three months, that’s real progress even if your actual starting point was 30% instead of 32%.
The current used is extremely low, around 50 kilohertz and less than 1 milliampere. You won’t feel it. It’s safe for most people but can interfere with pacemakers and other implanted electrical devices. More on that in the limitations section.
What the Numbers Actually Mean
The metrics smart scales report (muscle mass, bone mass, visceral fat level) aren’t direct measurements. They’re calculations based on the impedance reading combined with your age, height, and gender (which you enter during setup).
Two people with identical impedance readings but different ages will get different body fat percentages because the algorithm accounts for typical age-related composition changes.
This means the numbers are estimates, not lab results. But estimates that track consistently are still useful. If your muscle mass reading increases from 95 pounds to 98 pounds over two months of strength training, you’re building muscle regardless of whether the absolute numbers are perfectly accurate.
What Seniors Should Track
Body Fat Percentage
Healthy ranges for adults over 60 are approximately 24-36% for women and 18-28% for men. Higher percentages indicate excess fat that increases health risks: cardiovascular disease, type 2 diabetes, joint stress, inflammation.
Lower isn’t always better. Dropping below the healthy range can indicate inadequate nutrition or illness.
Tracking body fat percentage alongside weight reveals whether weight changes are fat loss, muscle loss, or both. If you lose 8 pounds but your body fat percentage stays the same, you lost muscle and fat proportionally (not ideal).
If you lose 8 pounds and your body fat percentage drops, you lost mostly fat (good outcome). If you maintain weight but body fat percentage drops, you’re replacing fat with muscle (excellent outcome for most seniors).
Muscle Mass
Declining muscle mass (sarcopenia) is one of the most important health metrics for seniors. Adults over 50 lose about 1-2% of muscle mass per year without resistance training. That loss accelerates after 60.
Less muscle means weaker grip strength, slower walking speed, higher fall risk, reduced independence, and increased mortality risk.
If your exercise program is building muscle, you should see this number increase or at least stabilize over time. Resistance training (bodyweight exercises, resistance bands, light weights) can reverse muscle loss at any age.
Tracking muscle mass tells you whether your program is working or whether you need to increase intensity, add more protein, or adjust your approach.
Bone Mass
Smart scale bone mass readings are rough estimates but can flag significant changes. The scales don’t actually measure bone density. They use your total weight, body fat percentage, and muscle mass to calculate an estimated bone mass.
A 150-pound person with high muscle mass and low body fat will have a higher estimated bone mass than a 150-pound person with low muscle and high fat.
A declining trend over several months warrants a conversation with your doctor about a DEXA scan for accurate bone density assessment. Don’t use smart scale bone readings to self-diagnose or monitor osteoporosis.
But if you see your estimated bone mass drop from 6.2 pounds to 5.4 pounds over six months, mention it at your next appointment.
Body Water Percentage
Adequate hydration supports muscle function, joint lubrication, and cognitive performance. Healthy body water percentage for adults is typically 45-60% for women and 50-65% for men.
The percentage naturally declines with age as muscle mass (which holds water) decreases and body fat (which contains little water) increases.
Tracking water percentage reveals chronic dehydration that affects your exercise capacity. If your water percentage consistently reads below 45%, you’re likely not drinking enough.
Dehydration reduces strength output during exercise, slows recovery, and increases injury risk. It also causes constipation, confusion, and urinary tract infections in older adults.
Visceral Fat Level
Many smart scales report visceral fat level on a numerical scale (typically 1-30). Visceral fat is fat stored around your internal organs rather than under your skin. It’s metabolically active and releases inflammatory compounds that increase disease risk.
A visceral fat level below 13 is generally considered healthy. Levels above 13 indicate excess visceral fat.
This metric can motivate dietary changes more effectively than body weight alone. You might see your weight drop only slightly while your visceral fat level falls from 15 to 10, indicating you’re losing the most dangerous type of fat even if total weight loss is modest.
Top Smart Scales for Seniors

Renpho Smart Body Fat Scale
Budget-friendly option with comprehensive tracking and easy-to-read display
Renpho Smart Body Fat Scale
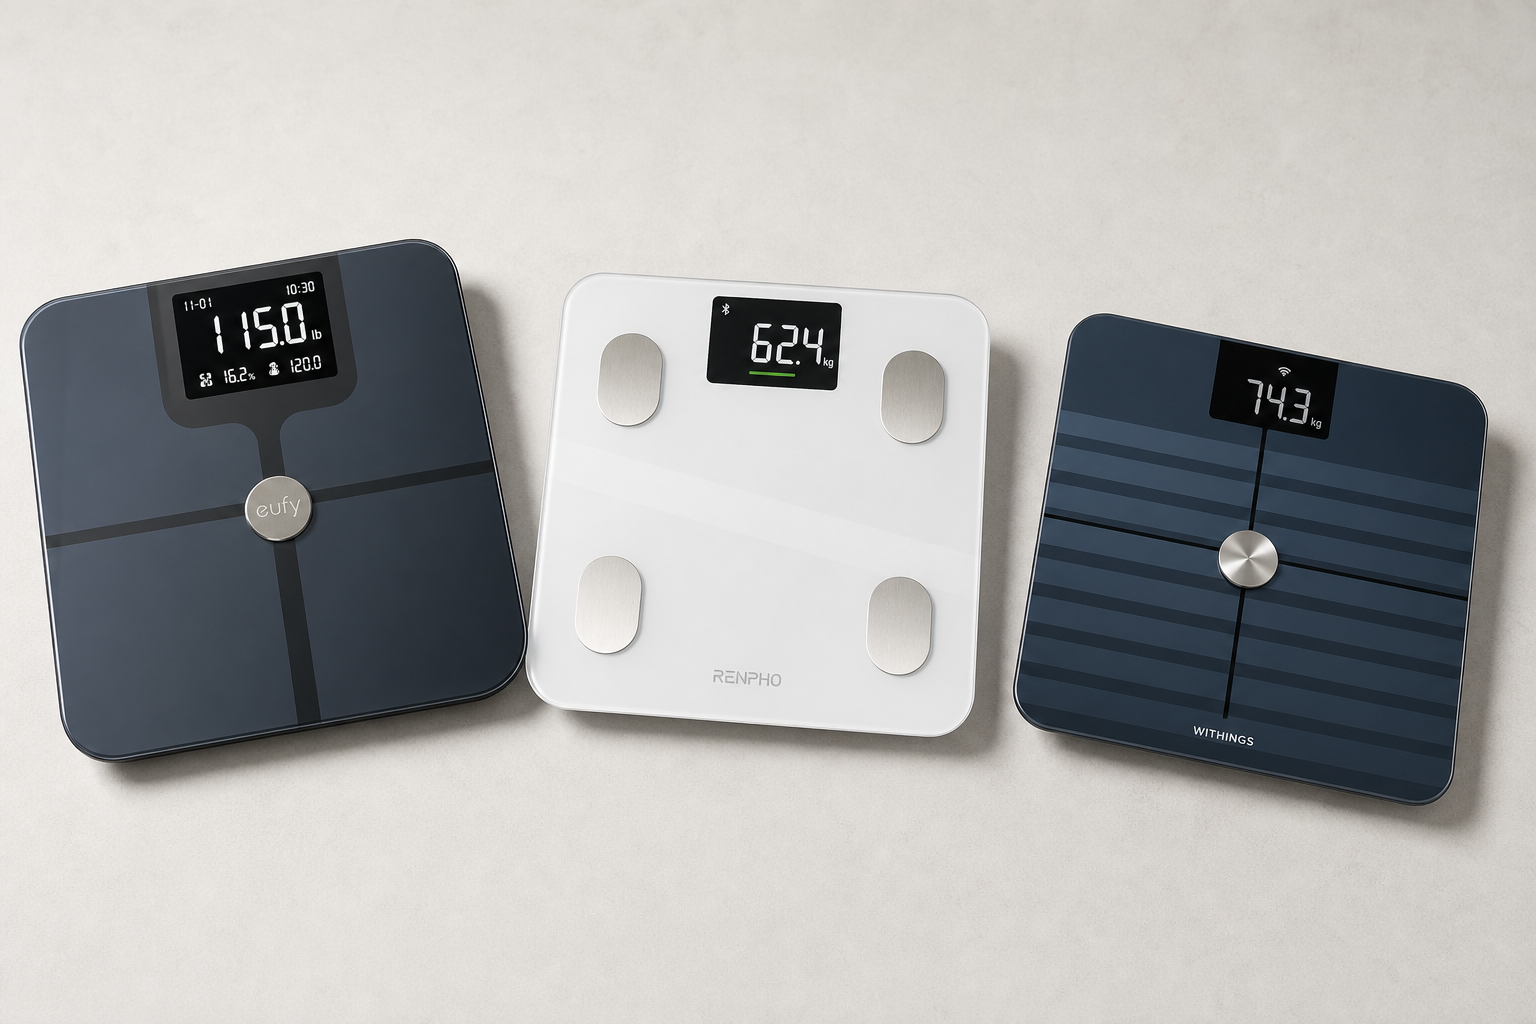
The Renpho scale measures 13 body composition metrics, syncs via Bluetooth to a free app (iOS and Android), and stores data for unlimited users. The large, backlit display shows weight clearly without squinting.
The app charts trends over time with easy-to-read graphs that highlight progress without overwhelming you with raw data tables.
This is a budget-friendly option that’s the best entry point for body composition tracking. The main limitation is Bluetooth-only syncing. You need to have your phone nearby and open the app during each weigh-in for the data to transfer.
If you forget, the scale stores up to 30 readings internally and syncs them the next time you open the app.
The platform is tempered glass with a weight capacity of 400 pounds. Four high-precision sensors provide consistent readings. Setup takes about 5 minutes: download the app, create a profile with your age, height, and gender, and step on the scale barefoot.
The first reading calibrates the scale to your body, and subsequent readings track changes from that baseline.
Best for: Budget-conscious seniors who want comprehensive tracking without premium pricing.

Withings Body+ Scale
Wi-Fi connectivity means automatic syncing without needing your phone nearby
Withings Body+ Scale
The Withings Body+ connects via Wi-Fi (no phone needed for syncing, unlike Bluetooth-only scales), displays a mini weather forecast and your weight trend directly on the scale’s screen, and integrates with Apple Health, Google Fit, and other health platforms.
The app is one of the most user-friendly for reviewing body composition trends, with color-coded graphs that show whether you’re in the healthy range for each metric.
The Wi-Fi sync means your data uploads automatically even if you leave your phone in another room. Step on the scale, get your readings on the display, and walk away. The data appears in the app the next time you open it.
This eliminates the friction of having to remember to open an app during every weigh-in.
The weather forecast feature seems gimmicky but is actually useful if you weigh yourself first thing in the morning. You get your weight and the day’s weather forecast in one place, which helps you decide what to wear for your morning walk without checking your phone.
The Body+ recognizes up to eight users automatically based on weight and composition profile. If multiple people in your household use the scale, it assigns readings to the correct person without requiring you to select your profile manually. Weight capacity is 396 pounds.
Best for: Seniors who want automatic data syncing without having to open an app during every weigh-in.
Eufy P2 Pro Smart Scale
The Eufy P2 Pro uses a 3D body composition model with ITO-coated glass (which means the entire surface is a sensor, not just small metal strips where your feet must land precisely).
This makes the readings more consistent and the experience more forgiving for seniors who don’t always step on the scale in exactly the same spot. Traditional scales with four metal footpads require you to position your feet accurately for reliable composition readings.
Miss the pads by an inch and you might get weight but not body fat data.
The ITO coating covers the full glass surface, so anywhere you step registers properly. This is particularly helpful if you have vision issues that make precise foot placement difficult, or if you weigh yourself in a dim bathroom before turning on bright lights.
Wi-Fi and Bluetooth connectivity. Integrates with Apple Health, Google Fit, and Fitbit. The app provides a virtual 3D body model that visualizes your composition changes over time, showing where you’re losing fat or building muscle.
Some users find this motivating. Others find it unnecessary. The core tracking features work the same whether you look at the 3D model or stick to the standard graphs.
Weight capacity is 400 pounds. The scale measures 16 body composition metrics, including protein percentage and metabolic age (an estimate of how your body composition compares to typical values for different age groups).
Metabolic age is mostly a motivational gimmick rather than a scientifically rigorous metric, but seeing it drop can reinforce that your exercise program is working.
Best for: Seniors who want the most accurate readings without having to worry about precise foot placement.
Greater Goods Smart Scale
The Greater Goods scale is another solid budget option that measures eight body composition metrics and syncs via Bluetooth. The standout feature is the exceptionally large LED display, which is easier to read than most competitors if you have vision limitations.
The numbers are nearly twice the size of the Renpho display.
The app is simpler than Withings or Eufy, with fewer bells and whistles. For some users that’s a drawback. For others it’s a benefit because there’s less clutter between you and the core data (weight, body fat, muscle mass trends).
The scale stores up to eight user profiles and auto-recognizes users after the initial setup.
Weight capacity is 400 pounds. The platform is slightly smaller than some competitors, which can be an issue if you wear larger shoe sizes and struggle to fit both feet comfortably on the surface. At size 12 or above, measure before buying.
Best for: Seniors who prioritize a large, easy-to-read display over advanced app features.
How to Get Accurate Readings
Consistency Matters More Than Precision
Weigh at the same time every day. Morning, after using the bathroom, before eating or drinking, wearing minimal clothing. Body weight fluctuates 2-4 pounds throughout the day based on food, water, and activity.
A large dinner can add 2-3 pounds that disappears by morning. An intense workout that causes significant sweating can temporarily drop weight by 3-4 pounds. Consistent timing controls these variables.
You’re not trying to get the most accurate single reading. You’re building a dataset that reveals trends. If you weigh yourself under identical conditions every day, the day-to-day noise averages out and the underlying trend (losing fat, building muscle, maintaining composition) becomes clear.
Proper Technique
Stand still for the full measurement. Most scales need 5-10 seconds to complete the BIA analysis. The display will show “loading” or a progress indicator. Don’t step off until all readings are complete.
Weight registers in the first 1-2 seconds, but body composition takes longer as the current passes through your tissues and the scale calculates the impedance.
Bare feet on the sensor plates. Socks, slippers, and shoes insulate your feet from the electrical current and invalidate the body composition readings. Weight reads correctly through footwear, but body fat and muscle mass don’t.
If you step on the scale with socks, you’ll get a weight number and either error messages for the composition metrics or wildly inaccurate readings (70% body fat, 30 pounds of muscle mass, etc.).
Your feet should be dry. Wet feet from a recent shower can alter the impedance reading, typically resulting in artificially low body fat percentages because the water on your skin conducts the current differently than dry skin.
Timing Around Exercise and Meals
Don’t weigh immediately after exercise. Exercise-related dehydration and blood flow changes temporarily alter BIA readings. An hour-long workout can shift your body water percentage down by 2-3%, which throws off the body fat calculation.
Wait at least 2 hours after vigorous exercise for the most accurate composition data. Morning weigh-ins before breakfast and before exercise avoid this problem entirely.
Similarly, a large meal temporarily increases body water as your digestive system processes food and fluid. Weighing right after dinner might show a body water percentage 3-4% higher than your actual baseline, which skews the body fat estimate in the other direction.
Track Weekly Averages, Not Daily Numbers
Daily fluctuations are normal and meaningless. Sodium intake affects water retention. Carbohydrate intake affects glycogen storage (which binds water). Bathroom habits affect weight by 1-2 pounds.
Hormonal changes (particularly for women) cause cyclical water retention. Your weight on Tuesday might be 3 pounds higher than Monday for reasons that have nothing to do with fat gain.
Your weekly average (Monday through Sunday) is the number that shows real trends. Most smart scale apps